How does Netdata's machine learning (ML) based anomaly detection actually work? Read on to find out!

How does Netdata's machine learning (ML) based anomaly detection actually work? Read on to find out!
Unlocking the full potential of monitoring through ML integration, anomaly detection, and innovative scoring engines.

We have recently extended the native machine learning (ML) based anomaly detection capabilities of Netdata to support all metrics, regardless on their collection frequency (update every).
Previously only metrics collected every second were supported, but now Netdata can run anomaly detection out of the box with zero config on metrics with any collection frequency.
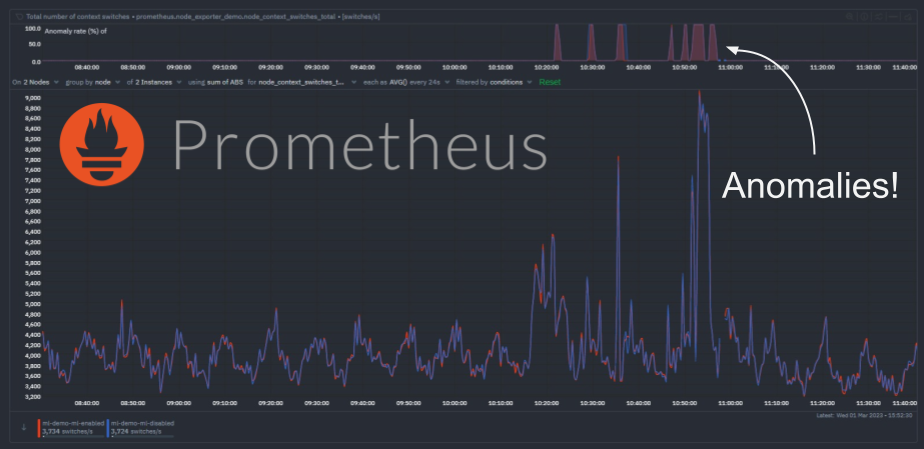
This post will illustrate an example of what this means using Prometheus metrics (via the Netdata Prometheus collector) since they typically have a default collection frequency of 10 seconds.
Following on from the recent launch of our Anomaly Advisor feature, and in keeping with our approach to machine learning, here is a detailed Python notebook outlining exactly how the machine learning powering the Anomaly Advisor actually works under the hood.
As of v1.35.0 the Netdata Agent can now run Metric Correlations (MC) itself. This means that, for nodes with MC enabled, the Metric Correlations feature just got a whole lot faster!
Today we are excited to launch one of our flagship ML assisted troubleshooting features in Netdata – the Anomaly Advisor.
The Anomaly Advisor builds on earlier work to introduce unsupervised anomaly detection capabilities into the Netdata Agent from v1.32.0 onwards.